Fig. 1
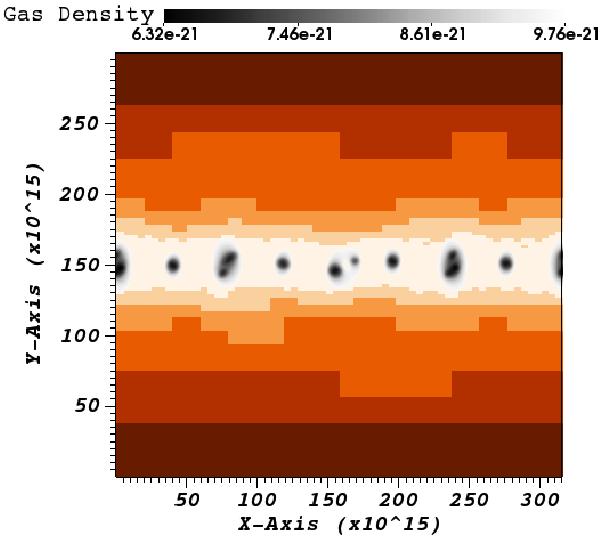
Full domain of a 2D simulation at t = 40. The background colour represents the refinement level with lighter colours being higher levels of refinement. While seven levels are used in the simulation, the coarsed level is no longer used at this time. In the middle, the gas density is overlaid to illustrate how the AMR chooses maximal refinement around the vortices.
Current usage metrics show cumulative count of Article Views (full-text article views including HTML views, PDF and ePub downloads, according to the available data) and Abstracts Views on Vision4Press platform.
Data correspond to usage on the plateform after 2015. The current usage metrics is available 48-96 hours after online publication and is updated daily on week days.
Initial download of the metrics may take a while.