Free Access
Fig. 6
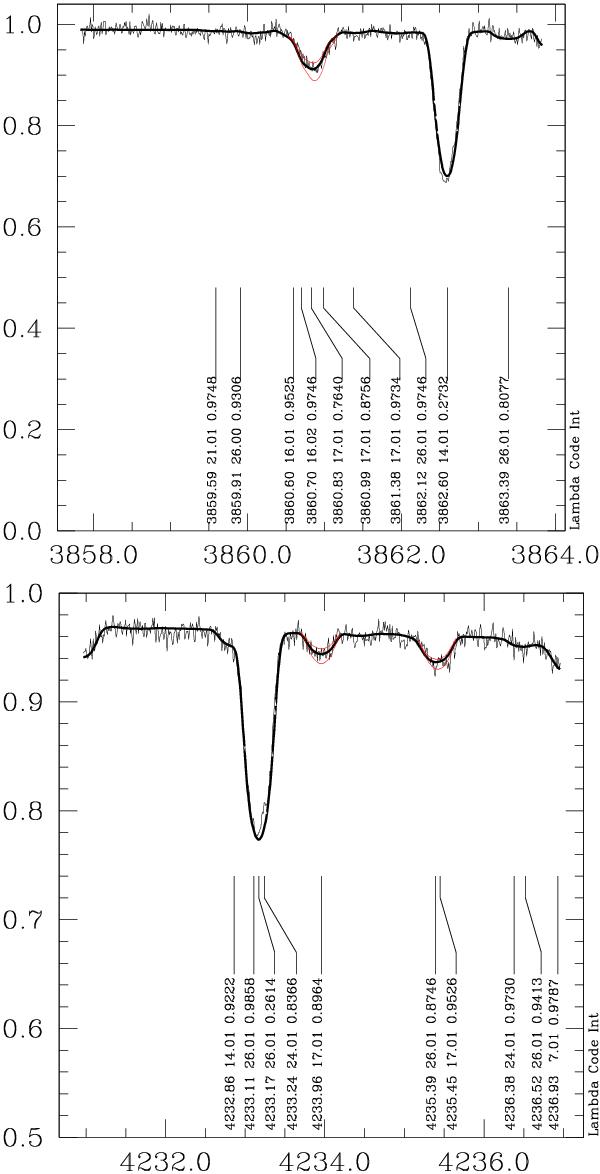
Spectral region near the Cl II lines 3860 and 4233 (upper and lower panels, respectively) identified in HD 5737. The observed and synthetic spectra are shown by thin and thick lines, respectively. The 2 thin red curves correspond to ±1σ abundance variation of the synthethic spectra.
This figure is made of several images, please see below:
Current usage metrics show cumulative count of Article Views (full-text article views including HTML views, PDF and ePub downloads, according to the available data) and Abstracts Views on Vision4Press platform.
Data correspond to usage on the plateform after 2015. The current usage metrics is available 48-96 hours after online publication and is updated daily on week days.
Initial download of the metrics may take a while.