Fig. 1
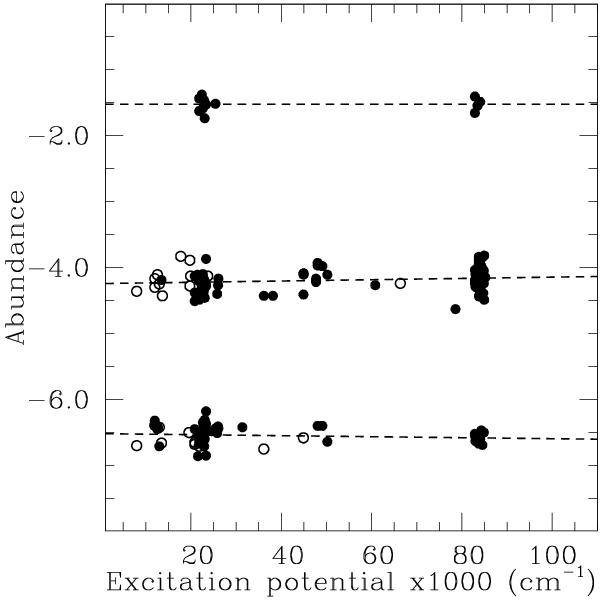
Example of abundance vs. excitation potential of Fe lines for the stars HD 23950, HD 5737, and HD 162678 (from top to bottom). Empty and filled circles correspond to Fe I and Fe II values, respectively. The straight lines show the position of a linear fit to the data. In this plot the abundance values have been displaced vertically to avoid superposition.
Current usage metrics show cumulative count of Article Views (full-text article views including HTML views, PDF and ePub downloads, according to the available data) and Abstracts Views on Vision4Press platform.
Data correspond to usage on the plateform after 2015. The current usage metrics is available 48-96 hours after online publication and is updated daily on week days.
Initial download of the metrics may take a while.