Fig. 8
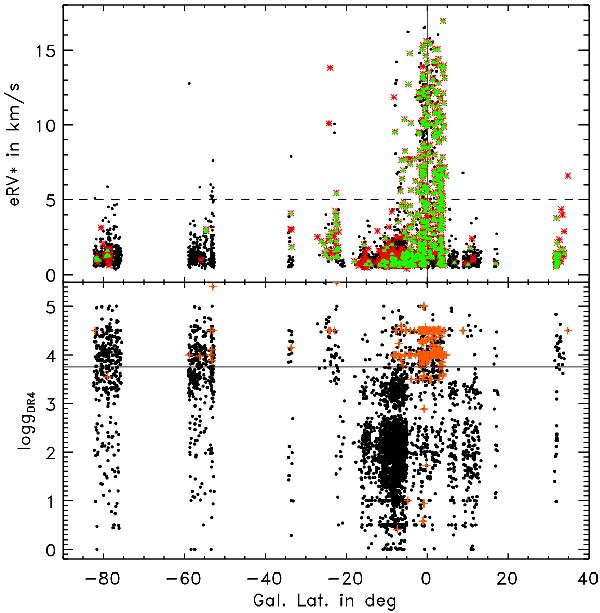
Distribution of eRV∗ and log g with respect to b along with the mid-plane and log g limit (3.75) overplotted as the black solid line in the upper and lower panels, respectively. The symbol colour-coding is the same as in Fig. 1, and dark orange crosses highlight targets with eRV∗ > 5 km s-1. This eRV∗ limit is displayed as the black dashed line.
Current usage metrics show cumulative count of Article Views (full-text article views including HTML views, PDF and ePub downloads, according to the available data) and Abstracts Views on Vision4Press platform.
Data correspond to usage on the plateform after 2015. The current usage metrics is available 48-96 hours after online publication and is updated daily on week days.
Initial download of the metrics may take a while.