Fig. 21
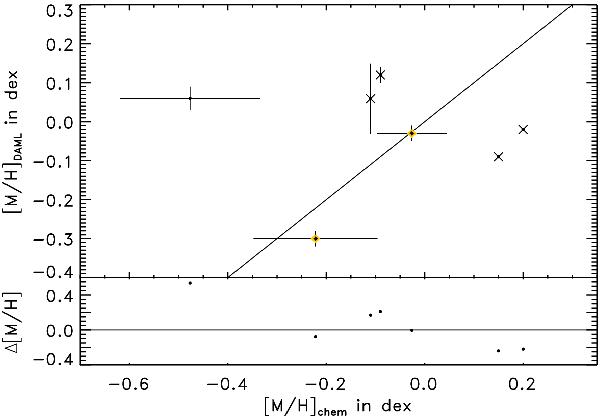
 comparison (upper panel) and difference distribution (lower
panel) between the results from the RAVE chemical pipeline (Boeche et al. 2011) and DAML, along with the
one-to-one relation and zero-difference line (black solid lines). Yellow diamonds
highlight OCs with ≥10 individual [M/H] measurements in DAML. Black crosses indicate
comparison (upper panel) and difference distribution (lower
panel) between the results from the RAVE chemical pipeline (Boeche et al. 2011) and DAML, along with the
one-to-one relation and zero-difference line (black solid lines). Yellow diamonds
highlight OCs with ≥10 individual [M/H] measurements in DAML. Black crosses indicate
 missing in one or both catalogues.
Current usage metrics show cumulative count of Article Views (full-text article views including HTML views, PDF and ePub downloads, according to the available data) and Abstracts Views on Vision4Press platform.
Data correspond to usage on the plateform after 2015. The current usage metrics is available 48-96 hours after online publication and is updated daily on week days.
Initial download of the metrics may take a while.