Fig. 13
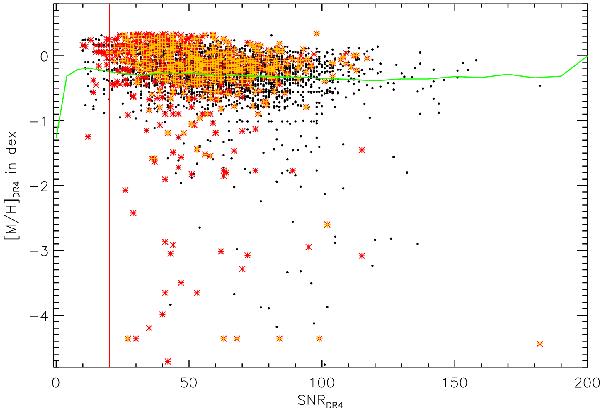
[M/H] distribution with respect to S/N for our high-quality RV sample (black dots). Red asterisks and orange crosses illustrate our good RV and [M/H] members, respectively. The red and green solid lines visualise our adapted cut at an S/N ≥ 20 and the overall trend for the entire RAVE DR4, respectively.
Current usage metrics show cumulative count of Article Views (full-text article views including HTML views, PDF and ePub downloads, according to the available data) and Abstracts Views on Vision4Press platform.
Data correspond to usage on the plateform after 2015. The current usage metrics is available 48-96 hours after online publication and is updated daily on week days.
Initial download of the metrics may take a while.