Fig. 5
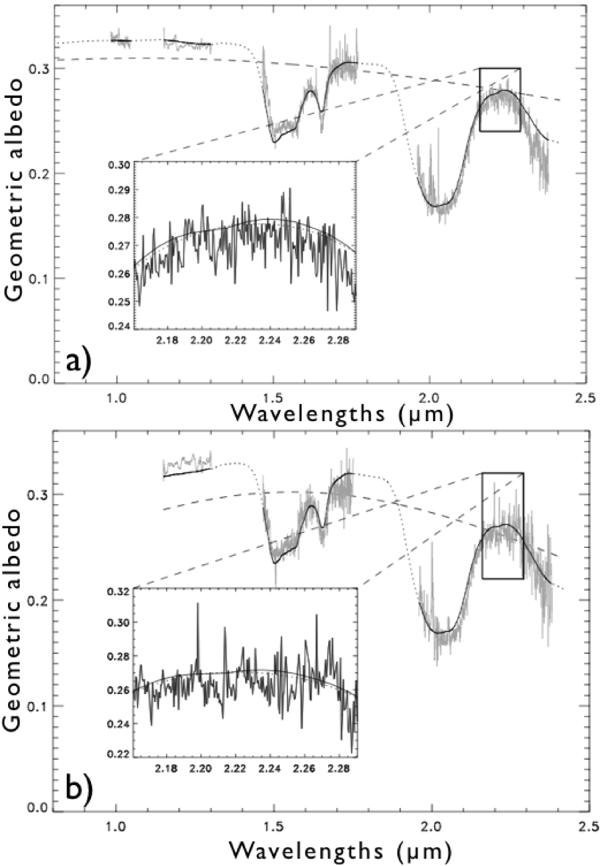
a) Spectrum of Miranda taken on 2012 September 25 (trailing hemisphere) and the result of our spectral modeling. The fit is represented by continuous (fit to spectral data) and dotted lines (extrapolation to regions with no data). The dashed line represents the continuum, which has been fitted and implemented in the model to reproduce the blue slope in the near infrared. The window in insert covers the [2.16–2.30] μm range. Two models are presented, both made of water ice (crystalline and amorphous) and amorphous carbon. The solid line shows the ammonia hydrate included in the model, while the dotted line corresponds to the model without ammonia. Both models fit nearly equally our spectroscopic data. b) Similar representation as above, but for the spectrum obtained on 2012 September 26 (leading hemisphere).
Current usage metrics show cumulative count of Article Views (full-text article views including HTML views, PDF and ePub downloads, according to the available data) and Abstracts Views on Vision4Press platform.
Data correspond to usage on the plateform after 2015. The current usage metrics is available 48-96 hours after online publication and is updated daily on week days.
Initial download of the metrics may take a while.