Fig. 4
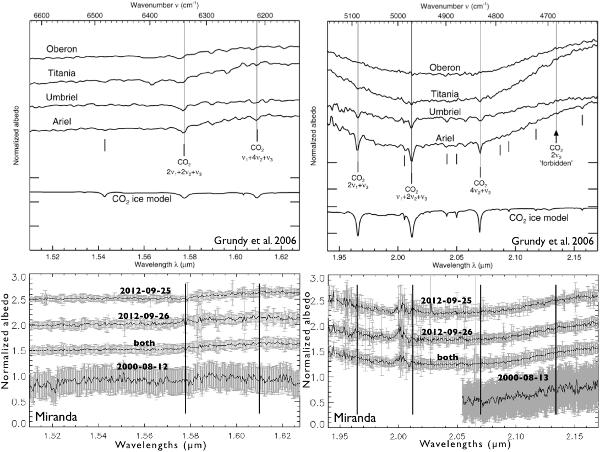
Top figure: SpeX spectra of the three outermost moons of Uranus (Grundy et al. 2006) showing increasing abundance of CO2 ice with decreasing planetocentric distances. Bottom figure: our PHARO and SpeX spectra (without the H-band spectra of 2000-08-13 due to some contamination by Uranus). The vertical solid lines represent the positions of the CO2 bands (including a forbidden band).
Current usage metrics show cumulative count of Article Views (full-text article views including HTML views, PDF and ePub downloads, according to the available data) and Abstracts Views on Vision4Press platform.
Data correspond to usage on the plateform after 2015. The current usage metrics is available 48-96 hours after online publication and is updated daily on week days.
Initial download of the metrics may take a while.