Fig. 3
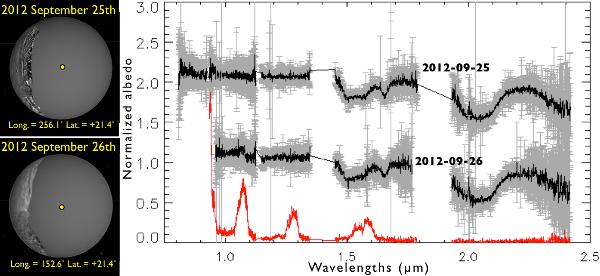
Left: as for Fig. 2, but for the epochs of the IRTF observations. The 1-sigma error bar of our spectra is shown for both dates (resolving power λ/Δλ is about 2000). The top spectrum has been offset by +1.0 units along the y-axis for clarity. The red curve on the bottom represents the location of the maximum of Uranus contamination (Sep. 26, 2012), which was subtracted from the spectrum.
Current usage metrics show cumulative count of Article Views (full-text article views including HTML views, PDF and ePub downloads, according to the available data) and Abstracts Views on Vision4Press platform.
Data correspond to usage on the plateform after 2015. The current usage metrics is available 48-96 hours after online publication and is updated daily on week days.
Initial download of the metrics may take a while.