Fig. 2
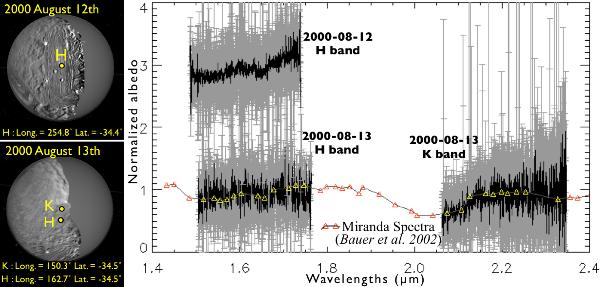
Left: surface of Miranda1 as observed from Palomar on the left side of the figure for both observing dates. The H-band spectrum of Miranda obtained on 2000 August 12 is shown at top, while the H- and K-band spectra collected on 2000 August 13 are shown at the bottom. The coordinates “Long.” and “Lat.” are respectively the apparent planetographic (“geodetic”) longitude and the latitude (IAU2006 model) corresponding to the observations (yellow points) at both dates. The one-sigma error bars are also shown for our spectra (resolving power λ/Δλ is about 1500). All spectra have been normalized to the data published by Bauer et al. (2002) (represented by the line curves with triangles). The top spectrum has been offset by +2.0 units along the y-axis for clarity. The regions with no data shown to correspond to high atmospheric opacity.
Current usage metrics show cumulative count of Article Views (full-text article views including HTML views, PDF and ePub downloads, according to the available data) and Abstracts Views on Vision4Press platform.
Data correspond to usage on the plateform after 2015. The current usage metrics is available 48-96 hours after online publication and is updated daily on week days.
Initial download of the metrics may take a while.