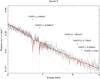
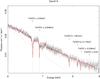
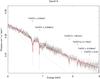
Fig. 3
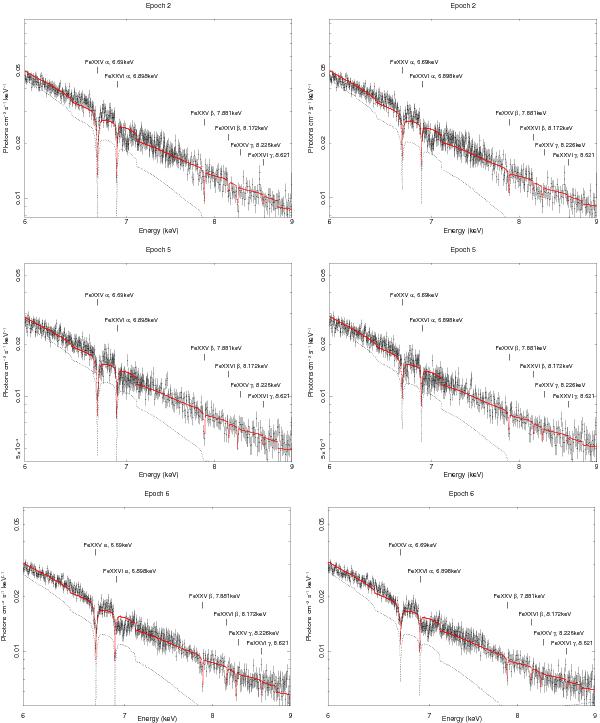
Iron line region from 6–9 keV, where absorption features are clearly seen. The various panels represent observations for three different epochs. Black crosses show the data, dotted black lines represent atm model, while solid red lines show the total model. Upper panels show the disk seen at i = 11 ± 5°, whereas lower panels show the disk seen at i = 70 ± 6°. All spectra favor fitting for i = 11 ± 5°, since modeled lines are the deepest for this model.
Current usage metrics show cumulative count of Article Views (full-text article views including HTML views, PDF and ePub downloads, according to the available data) and Abstracts Views on Vision4Press platform.
Data correspond to usage on the plateform after 2015. The current usage metrics is available 48-96 hours after online publication and is updated daily on week days.
Initial download of the metrics may take a while.