Fig. 2
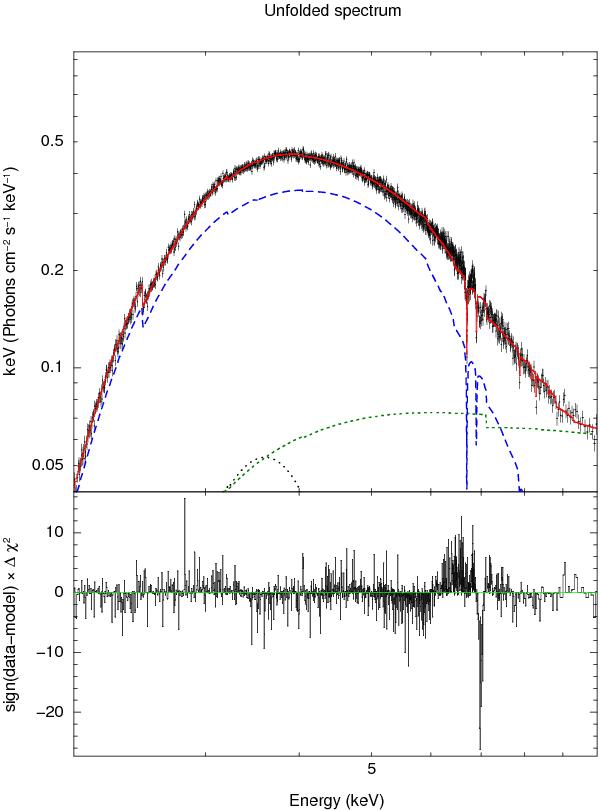
Fitting of atmospheric disk model to the Epoch 3 data in the range 2–9 keV. The observed data, black crosses, are the sum of three front-illuminated (XIS0,2,3) and one back-illuminated (XIS1) CCDs. The total model wabs * (atm+pl + gaussian) is represented by a red line. Separate model components are represented by: a long-dashed blue line – atm, short-dashed green line – pl, and dotted black line – instrumental gaussian. Reduced χ2/d.o.f. = 2618.57/2182 = 1.2 for the total model.
Current usage metrics show cumulative count of Article Views (full-text article views including HTML views, PDF and ePub downloads, according to the available data) and Abstracts Views on Vision4Press platform.
Data correspond to usage on the plateform after 2015. The current usage metrics is available 48-96 hours after online publication and is updated daily on week days.
Initial download of the metrics may take a while.