Fig. 1
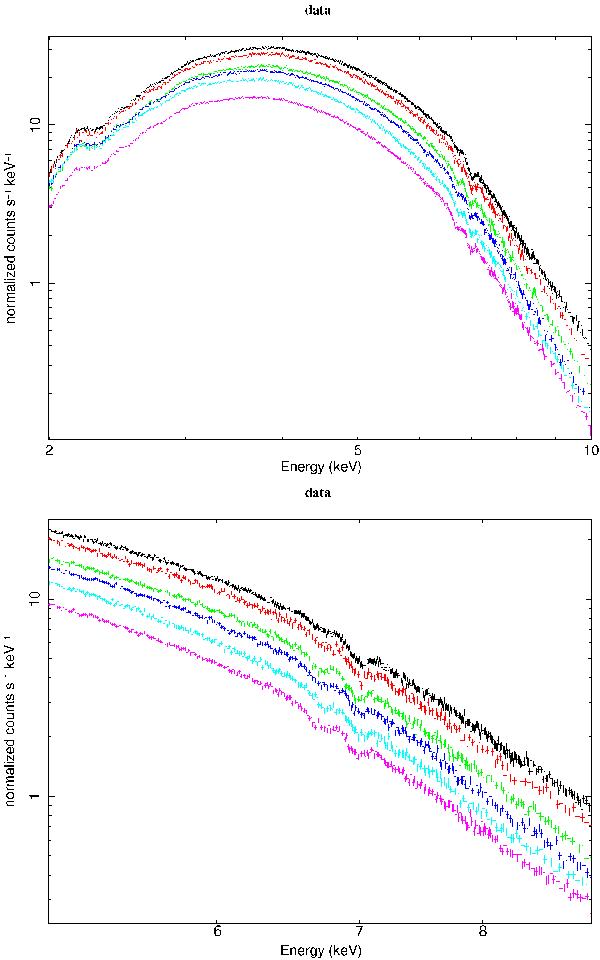
Upper panel: X-ray spectra of 4U 1630-472 obtained with the XIS023 showing a prominent bump similar to multi-temperature disk emission. Lower panel: focus on the iron line region from 5–9 keV, where absorption features are clearly seen. Colors mean different epochs of observations starting from black – epoch 1, up to magenta – epoch 6. The data are very similar to those presented in Kubota et al. (2007) in Figs. 2 and 5.
Current usage metrics show cumulative count of Article Views (full-text article views including HTML views, PDF and ePub downloads, according to the available data) and Abstracts Views on Vision4Press platform.
Data correspond to usage on the plateform after 2015. The current usage metrics is available 48-96 hours after online publication and is updated daily on week days.
Initial download of the metrics may take a while.