Free Access
Fig. 6
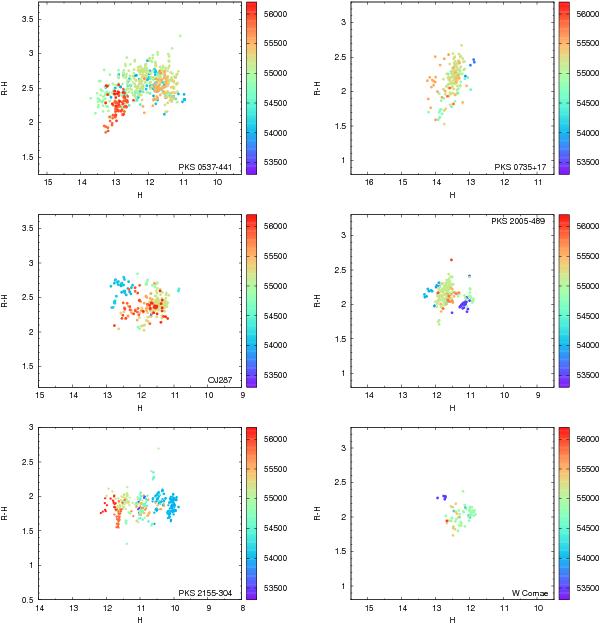
Color-intensity diagrams for the BL Lacs. The color of each point is related to the epoch of detections of corresponding data, according to the bar on the right. Error bars are omitted for readability.
Current usage metrics show cumulative count of Article Views (full-text article views including HTML views, PDF and ePub downloads, according to the available data) and Abstracts Views on Vision4Press platform.
Data correspond to usage on the plateform after 2015. The current usage metrics is available 48-96 hours after online publication and is updated daily on week days.
Initial download of the metrics may take a while.