Fig. 4
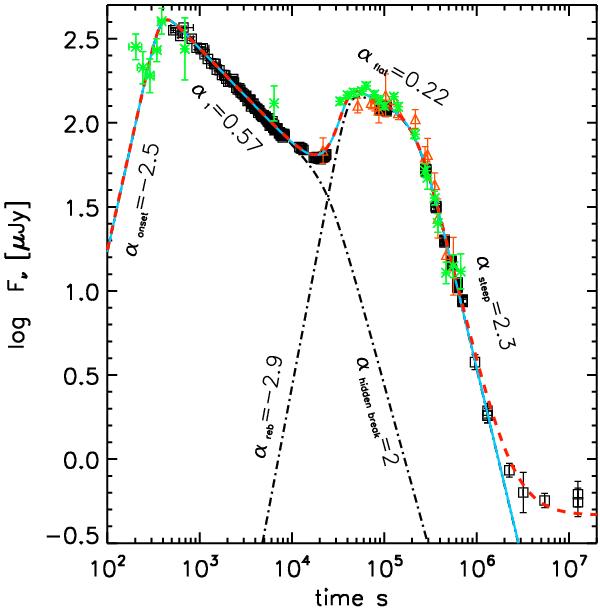
Monochromatic r′ band light curve of GRB 100814A fitted as the sum of two smoothly connected triple power-laws plus the contribution of the host galaxy (red dashed line). Black squares represent the GROND r′ photometry, while green crosses and red triangles represent UVOT u and v bands respectively, rescaled to the r′ band flux as described in the text.
Current usage metrics show cumulative count of Article Views (full-text article views including HTML views, PDF and ePub downloads, according to the available data) and Abstracts Views on Vision4Press platform.
Data correspond to usage on the plateform after 2015. The current usage metrics is available 48-96 hours after online publication and is updated daily on week days.
Initial download of the metrics may take a while.