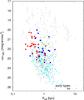
Fig. 6
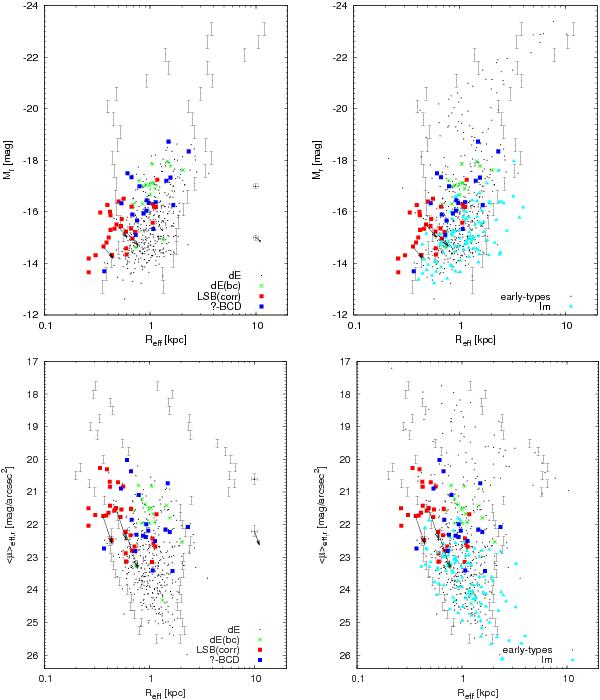
Effective radius Reff vs. absolute magnitude (top panels) and mean effective surface brightness (bottom panels). Symbols are the same as in Fig. 5. The black error bars in the left-hand panels illustrate the statistical errors, while the arrows indicate the systematic error, as derived from analysing artificial BCD images (see the Appendix). The error bars are placed on the ordinate so that they correspond to the average surface brightness and the magnitude of the respective set of artificial BCDs. The arrows point in the direction towards which the measurements would have to be shifted to correct for the systematic error. Note that the upper arrow is almost invisible due to the very small error.
Current usage metrics show cumulative count of Article Views (full-text article views including HTML views, PDF and ePub downloads, according to the available data) and Abstracts Views on Vision4Press platform.
Data correspond to usage on the plateform after 2015. The current usage metrics is available 48-96 hours after online publication and is updated daily on week days.
Initial download of the metrics may take a while.