Fig. 5
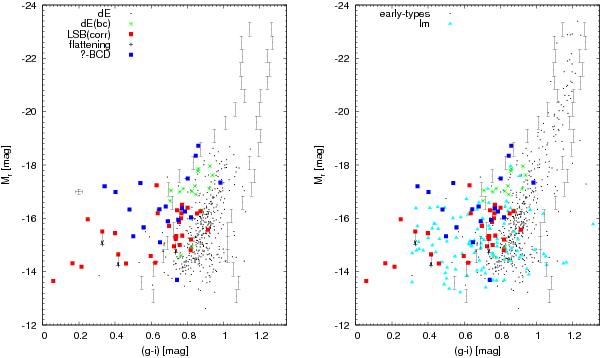
Left: colour−magnitude diagram of the LSB-components of our primary BCD sample, compared to the Virgo early-type dwarf galaxies (labelled “dE” but including dS0s), for which colours were derived within 2Reff. Red squares correspond to values of the LSB-components, where black crosses show LSB-components with inner profile flattening. The notation “LSB(corr)” indicates that the parameters of the LSB-components are corrected for the outer tail (see Sect. 3.5). The black vectors display the change of the parameters when an inner profile flattening is applied. Green asterisks correspond to dE(bc)s and blue squares to galaxies with a uncertain morphological classification (see Sect. 4.4). Typical errors are shown on the left-hand side. Right: same diagram, but additionally plotted are the irregulars (cyan triangles) and the entire population of early-type galaxies (black dots). In both panels we indicate the 2σ-region of the entire ETG population with vertical bars.
Current usage metrics show cumulative count of Article Views (full-text article views including HTML views, PDF and ePub downloads, according to the available data) and Abstracts Views on Vision4Press platform.
Data correspond to usage on the plateform after 2015. The current usage metrics is available 48-96 hours after online publication and is updated daily on week days.
Initial download of the metrics may take a while.