Fig. 4
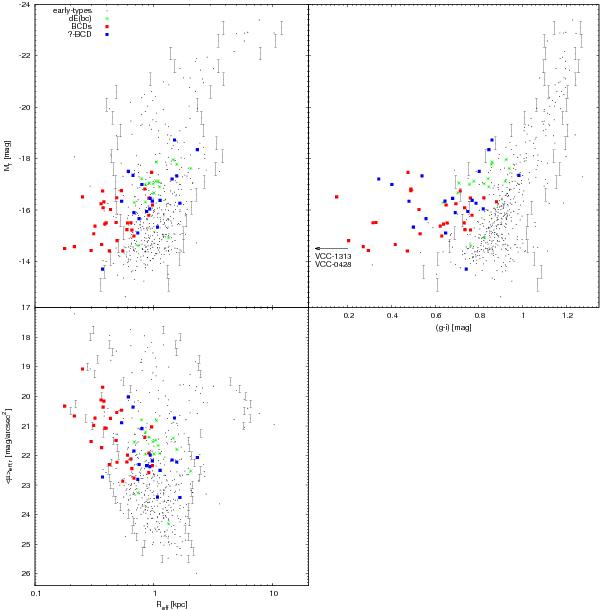
The Mr − (g − i) − Reff − ⟨μ⟩eff-plane of BCDs and ETGs. No decomposition into starburst and LSB-component was applied. Red squares represent the primary BCD sample, blue squares denote the candidate sample. Black dots represent the sample of early-type galaxies taken from Janz & Lisker (2008, 2009), for which colours were derived from the light within 2Reff. Green asterisks are dE(bc)s from Lisker et al. (2006b). For each (vertical) interval in magnitude or surface brightness, the (horizontal) ± 2σ-region of the ETGs is indicated by the black bars. VCC 0428 and 1313 have colours ((g − i)tot = −0.049 and −0.263mag, respectively), lying outside the colour range of the plot and are therefore only indicated by an arrow.
Current usage metrics show cumulative count of Article Views (full-text article views including HTML views, PDF and ePub downloads, according to the available data) and Abstracts Views on Vision4Press platform.
Data correspond to usage on the plateform after 2015. The current usage metrics is available 48-96 hours after online publication and is updated daily on week days.
Initial download of the metrics may take a while.