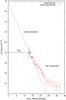
Fig. 3
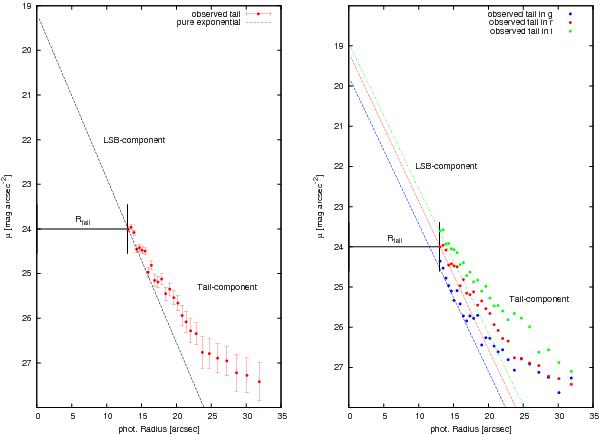
Surface brightness profile of a BCD (VCC 0001). Left panel: the line corresponds to an exponential fit to the LSB-component and the red data points show the outer tail in the r-band. Right panel: same, but for the g, r and i-filters. Obvious are the outer tails of the profiles at low surface brightness levels. The horizontal bars indicate the radius at which the profile starts deviating from a pure exponential fit.
Current usage metrics show cumulative count of Article Views (full-text article views including HTML views, PDF and ePub downloads, according to the available data) and Abstracts Views on Vision4Press platform.
Data correspond to usage on the plateform after 2015. The current usage metrics is available 48-96 hours after online publication and is updated daily on week days.
Initial download of the metrics may take a while.