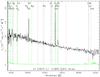
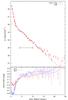
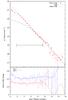
Fig. 2
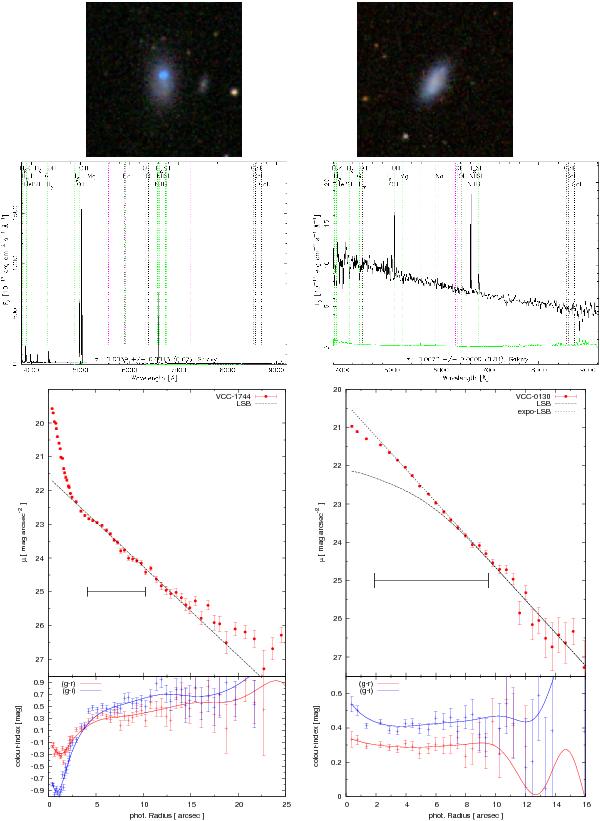
Colour images from SDSS (upper panels), spectra (middle panels), as well as surface brightness and colour profiles (lower panels) of VCC 1744 (left) and VCC 0130 (right). In the case of VCC 1744 a pure exponential law was assumed to fit the LSB-component, while for VCC 0130 an inner profile flattening was assumed (black dashed lines). The horizontal bar denotes the interval in R⋆over which the LSB-component was fitted. The images in this figure and throughout the paper have a width of 80′′, corresponding to 6.3 kpc at a distance of 16.5 Mpc. They were obtained from the online Image List Tool of the SDSS (http://skyserver.sdss3.org/dr8/en/tools/chart/list.asp) and were slightly enhanced at low intensity, using the same correction curve for all.
Current usage metrics show cumulative count of Article Views (full-text article views including HTML views, PDF and ePub downloads, according to the available data) and Abstracts Views on Vision4Press platform.
Data correspond to usage on the plateform after 2015. The current usage metrics is available 48-96 hours after online publication and is updated daily on week days.
Initial download of the metrics may take a while.