Free Access
Fig. 9
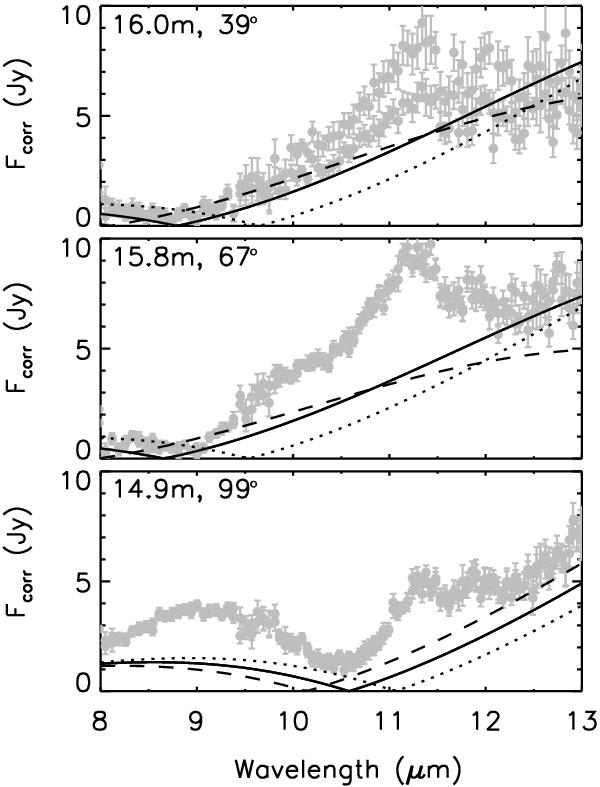
Same data as in Fig. 5, but plotted in grey for both calibrations. Full lines show the model prediction for the correlated fluxes on these baselines (see Sect. 5.2). The dotted and the dashed lines present the model result for inclination angles 45° and 61° respectively, compared to our model with 53° shown with full lines.
Current usage metrics show cumulative count of Article Views (full-text article views including HTML views, PDF and ePub downloads, according to the available data) and Abstracts Views on Vision4Press platform.
Data correspond to usage on the plateform after 2015. The current usage metrics is available 48-96 hours after online publication and is updated daily on week days.
Initial download of the metrics may take a while.