Fig. 8
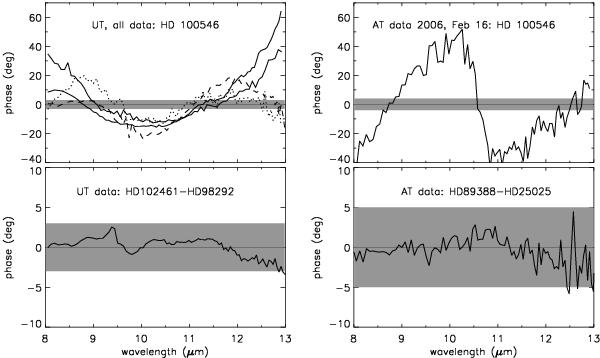
Top left: calibrated chromatic phases of our UT baseline measurements of HD 100546. The 34 m baselines is plotted with dotted and 41 m baselines with full lines. The 70 m baseline presented in Leinert et al. (2004) is plotted with the dashed line. A linear, atmospheric term has been subtracted from the shown phases. Also shown are the zero phases, as predicted from our point symmetric model. The grey area represents the ±3° tolerance for deviation from zero. Top right: calibrated chromatic phases of our AT baseline measurement of HD 100546 taken on 2006 February 16. The tolerance for deviation from zero (point symmetric model) is ±5° and indicated in grey. Bottom left: differences between the measured phases of two point-source calibrators (no asymmetry) at different airmasses, to illustrate the level of atmospheric contributions of our UT measurements. Bottom right: as above, for our AT measurements.
Current usage metrics show cumulative count of Article Views (full-text article views including HTML views, PDF and ePub downloads, according to the available data) and Abstracts Views on Vision4Press platform.
Data correspond to usage on the plateform after 2015. The current usage metrics is available 48-96 hours after online publication and is updated daily on week days.
Initial download of the metrics may take a while.