Fig. 6
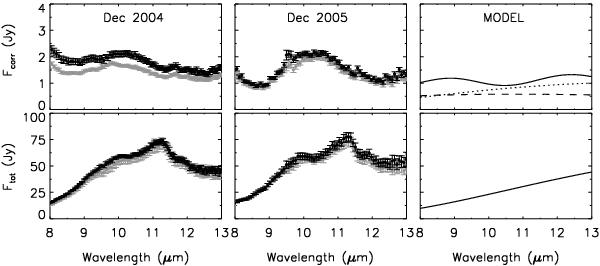
Upper panels: correlated fluxes from UT-baseline measurements observed in December 2004 and December 2005, and from our model. The baseline length and orientation is 41 m and 30° in both observations. Black and grey symbols are used to distinguish results obtained by using two different calibrators. Error bars correspond to instrumental errors. The dashed and dotted lines show the contribution of the inner rim and the inner disc, respectively (Sect. 5.1). The full line shows the final correlated flux including contributions from all disc components (Sect. 5.2). Lower panels: total unmasked fluxes measured on the UTs simultaneously with the above observations from December 2004 and December 2005, and the modelled total flux. As before, black and grey symbols correspond to the use of two different calibrators. Errors shown are due to instrumental errors.
Current usage metrics show cumulative count of Article Views (full-text article views including HTML views, PDF and ePub downloads, according to the available data) and Abstracts Views on Vision4Press platform.
Data correspond to usage on the plateform after 2015. The current usage metrics is available 48-96 hours after online publication and is updated daily on week days.
Initial download of the metrics may take a while.