Fig. 5
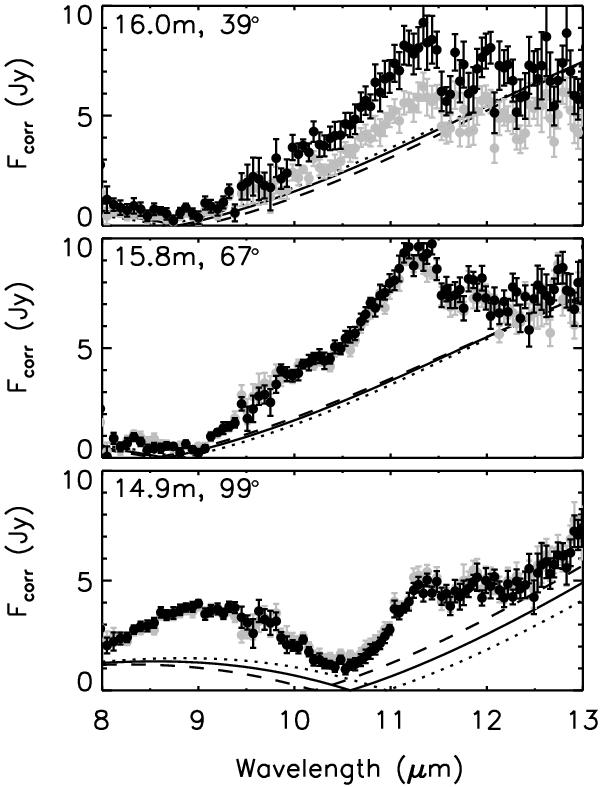
Correlated fluxes obtained with MIDI using the ATs in February 2006. Baseline lengths and orientations are indicated. Black and grey symbols correspond to data reduction using two different calibrators, observed immediately prior to or following the science target. The calibration errors are within 20%. The plotted data errors are instrumental errors. Full lines show the model prediction for the correlated fluxes on these baselines (see Sect. 5.2). The dotted and the dashed lines present the model result for position angles 140° and 150°, respectively, compared to our model with 145° shown with full lines.
Current usage metrics show cumulative count of Article Views (full-text article views including HTML views, PDF and ePub downloads, according to the available data) and Abstracts Views on Vision4Press platform.
Data correspond to usage on the plateform after 2015. The current usage metrics is available 48-96 hours after online publication and is updated daily on week days.
Initial download of the metrics may take a while.