Free Access
Fig. 4
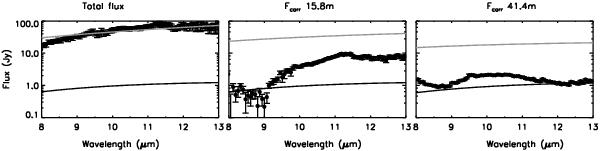
Left to right: total fluxes, correlated fluxes on a 15 m baseline, correlated fluxes on a 40 m baseline. Neither of the radially continuous disc models with radii 0.7 and 25 AU (black and grey lines, respectively) match all three types of data.
Current usage metrics show cumulative count of Article Views (full-text article views including HTML views, PDF and ePub downloads, according to the available data) and Abstracts Views on Vision4Press platform.
Data correspond to usage on the plateform after 2015. The current usage metrics is available 48-96 hours after online publication and is updated daily on week days.
Initial download of the metrics may take a while.