Fig. 1
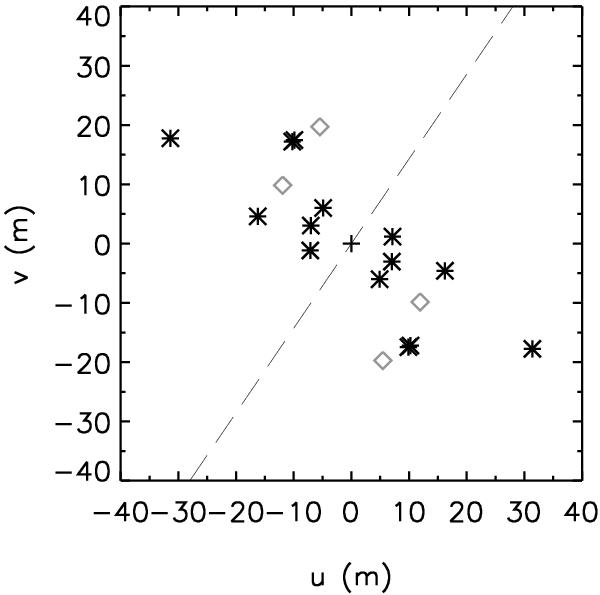
uv-plane coverage of all MIDI observations HD 100546 taken before 2012. North is up and East is left. The baselines presented and analysed in this paper are marked by black asterisks. The longest baseline is presented in (Leinert et al. 2004). In addition to their analysis we here present the chromatic phases from this measurement (see Sect. 5.3). The data from the remaining baselines, shown with grey diamonds, are excluded because of poor quality. The orientation of disc major axis used in this work is shown with the dashed line.
Current usage metrics show cumulative count of Article Views (full-text article views including HTML views, PDF and ePub downloads, according to the available data) and Abstracts Views on Vision4Press platform.
Data correspond to usage on the plateform after 2015. The current usage metrics is available 48-96 hours after online publication and is updated daily on week days.
Initial download of the metrics may take a while.