Free Access
Fig. 7
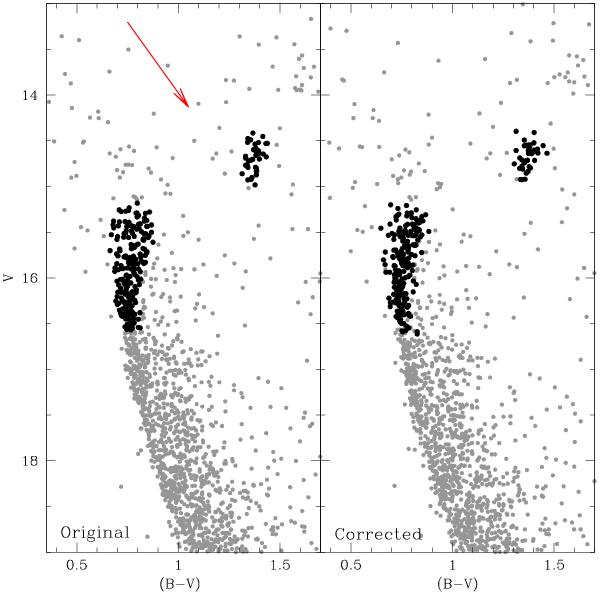
CMDs for Tr 20 stars (photometry from C10) with distance from the cluster centre d < 4′. Left panel: original photometry. The red arrow shows the direction of the reddening vector. Right panel: photometry corrected for DR. The TO and RC regions are plotted in black to clearly show the effect of the correction for DR.
Current usage metrics show cumulative count of Article Views (full-text article views including HTML views, PDF and ePub downloads, according to the available data) and Abstracts Views on Vision4Press platform.
Data correspond to usage on the plateform after 2015. The current usage metrics is available 48-96 hours after online publication and is updated daily on week days.
Initial download of the metrics may take a while.