Free Access
Fig. 5
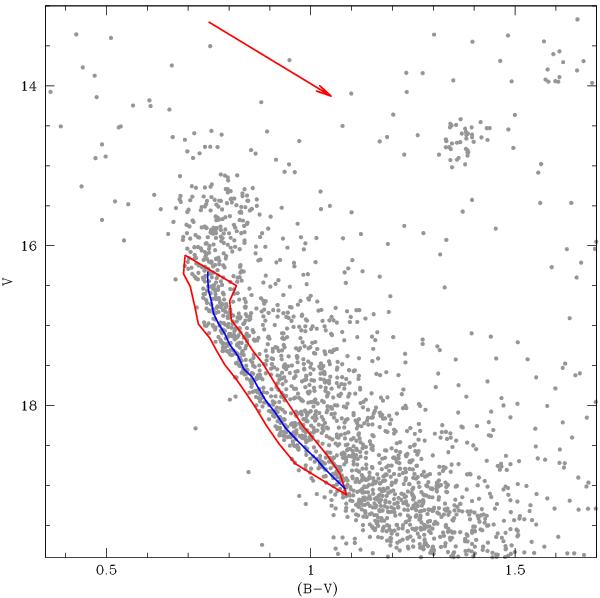
CMD of Tr 20 inside 4′. The red box and the blue line indicate the MS box and the fiducial line for the DR estimate. The red arrow indicates the reddening vector, both in direction and size.
Current usage metrics show cumulative count of Article Views (full-text article views including HTML views, PDF and ePub downloads, according to the available data) and Abstracts Views on Vision4Press platform.
Data correspond to usage on the plateform after 2015. The current usage metrics is available 48-96 hours after online publication and is updated daily on week days.
Initial download of the metrics may take a while.