Fig. 3
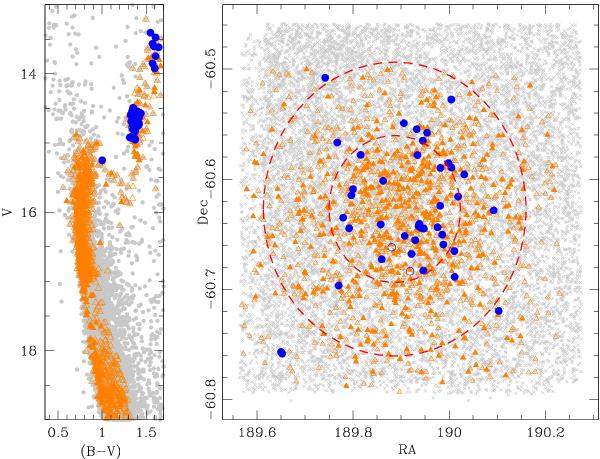
Left panel: CMD of the GES targets for Tr 20 with a distance from the centre d < 8′. Right panel: spatial distribution of the GES targets; the red dashed circles define the regions for d < 4′ and d < 8′ from the centre. In both panels, the orange triangles are GIRAFFE targets, while the blue filled circles are those of UVES; filled symbols are candidate members for RV (see Sect. 5). The stars in the photometric catalogue are plotted in grey.
Current usage metrics show cumulative count of Article Views (full-text article views including HTML views, PDF and ePub downloads, according to the available data) and Abstracts Views on Vision4Press platform.
Data correspond to usage on the plateform after 2015. The current usage metrics is available 48-96 hours after online publication and is updated daily on week days.
Initial download of the metrics may take a while.