Fig. 9
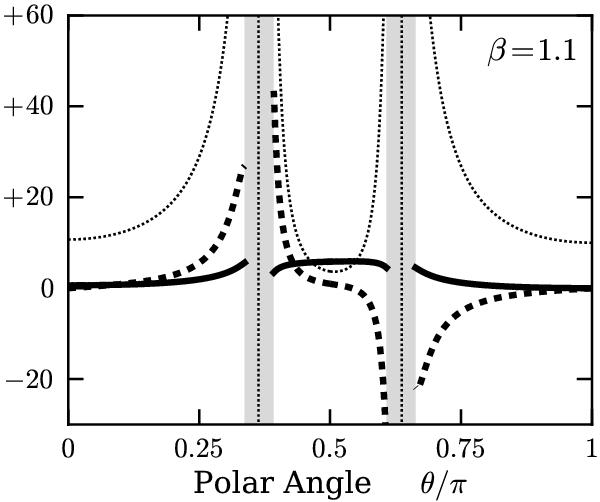
Angular variation of perturbation coefficients for β = 1.1 . The
dashed curves show  , while
the dotted curves are g-2, again using the best-fit
parameters from Fig. 7. Finally, the solid
curve is the integrated f0. As in Fig. 8, all variables diverge within the shaded
regions straddling the two Mach cones.
, while
the dotted curves are g-2, again using the best-fit
parameters from Fig. 7. Finally, the solid
curve is the integrated f0. As in Fig. 8, all variables diverge within the shaded
regions straddling the two Mach cones.
Current usage metrics show cumulative count of Article Views (full-text article views including HTML views, PDF and ePub downloads, according to the available data) and Abstracts Views on Vision4Press platform.
Data correspond to usage on the plateform after 2015. The current usage metrics is available 48-96 hours after online publication and is updated daily on week days.
Initial download of the metrics may take a while.