Fig. 8
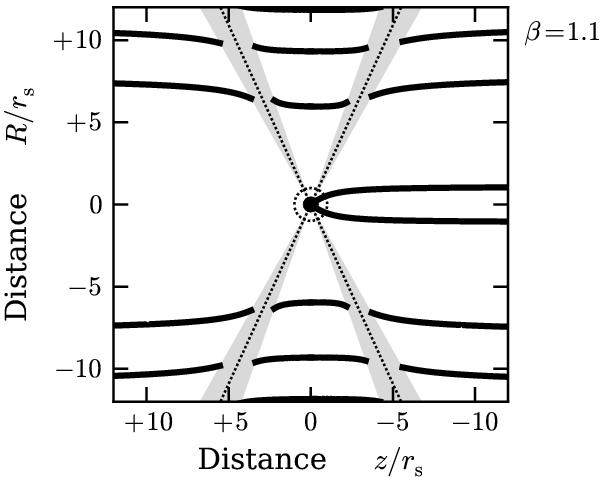
Streamlines of the second-order flow, for β = 1.1 , constructed using the best-fit parameters from Fig. 7. The shaded regions surrounding the two Mach cones represent sectors in which the perturbation coefficients diverge. Also indicated are the central mass and the surrounding circle corresponding to r = 1 . Notice that the innermost streamlines reach the origin, indicating the occurrence of mass accretion.
Current usage metrics show cumulative count of Article Views (full-text article views including HTML views, PDF and ePub downloads, according to the available data) and Abstracts Views on Vision4Press platform.
Data correspond to usage on the plateform after 2015. The current usage metrics is available 48-96 hours after online publication and is updated daily on week days.
Initial download of the metrics may take a while.