Fig. 4
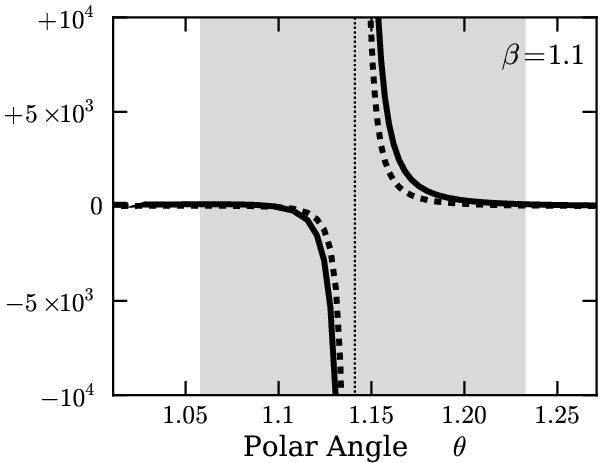
Asymmetric divergences at the Mach angle, for β = 1.1 . The solid
and dashed curves trace  and
g-2, respectively, close to the Mach angle
θM, marked here by the vertical,
dotted line. The functions diverge antisymmetrically once we choose
C2 = 1 . Both curves are taken from the numerical
integration outlined in Sect. 4.5. The shaded region is that which we remove before
enforcing continuity of f0 and
g-2 across the cones.
and
g-2, respectively, close to the Mach angle
θM, marked here by the vertical,
dotted line. The functions diverge antisymmetrically once we choose
C2 = 1 . Both curves are taken from the numerical
integration outlined in Sect. 4.5. The shaded region is that which we remove before
enforcing continuity of f0 and
g-2 across the cones.
Current usage metrics show cumulative count of Article Views (full-text article views including HTML views, PDF and ePub downloads, according to the available data) and Abstracts Views on Vision4Press platform.
Data correspond to usage on the plateform after 2015. The current usage metrics is available 48-96 hours after online publication and is updated daily on week days.
Initial download of the metrics may take a while.