Fig. 7
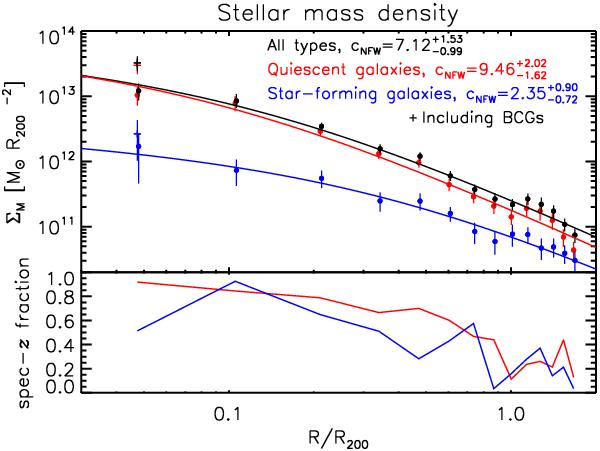
Stellar mass density distribution in galaxies with stellar masses > 1010.2 M⊙ of the composite cluster as a function of radial distance. Comparing these distributions to those shown in Fig. 6, we find that the stellar mass distributions are peaked more strongly than the number density distribution. That is an indication for mass segregation of quiescent galaxies in these systems. The lower panel shows the fraction of stellar mass in galaxies with a spectroscopic redshift.
Current usage metrics show cumulative count of Article Views (full-text article views including HTML views, PDF and ePub downloads, according to the available data) and Abstracts Views on Vision4Press platform.
Data correspond to usage on the plateform after 2015. The current usage metrics is available 48-96 hours after online publication and is updated daily on week days.
Initial download of the metrics may take a while.