Fig. 9
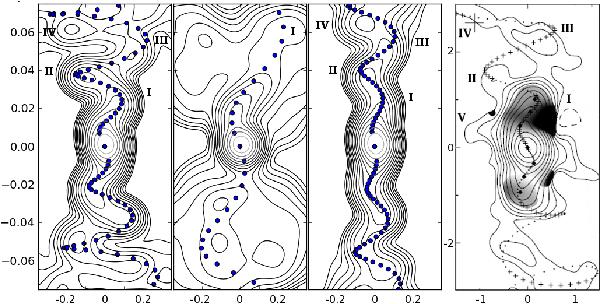
Left to right: radio map from simulations cases A, B, and C. Units are given in parsec, the object is estimated to be at a distance of 5.5 kpc. All graphs overplot the kinematic model with parameters corresponding to the case. Right: VLA image of the microquasar SS433 in the constellation Aquila, adapted from Roberts et al. (2008), units are given in arcsecond, with the kinematic model for SS433 overplotted. Both simulated radiomap and observations take contours with steps of factors of  .
.
Current usage metrics show cumulative count of Article Views (full-text article views including HTML views, PDF and ePub downloads, according to the available data) and Abstracts Views on Vision4Press platform.
Data correspond to usage on the plateform after 2015. The current usage metrics is available 48-96 hours after online publication and is updated daily on week days.
Initial download of the metrics may take a while.