Fig. 8
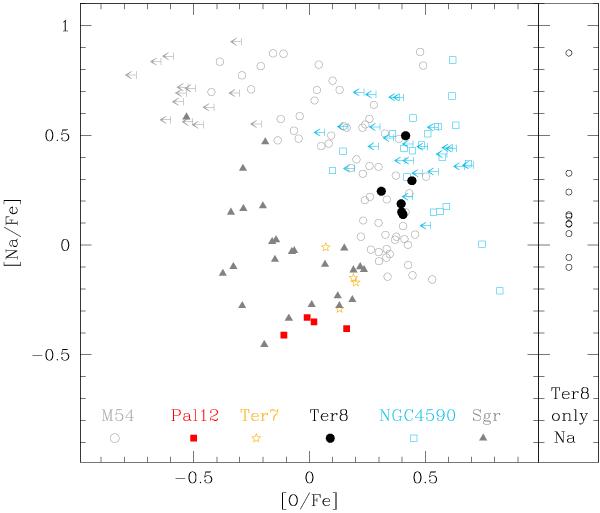
The Na-O anticorrelation for individual stars in all confirmed Sgr GCs (plus NGC 4590). For Ter 8, we also show the variation in Na for all the stars with GIRAFFE spectra in the right panel. In the left panel, M 54 (grey empty circles), NGC 4590 (empty squares), and Ter 8 (filled black circles) come from our homogeneous analysis (Carretta et al. 2010c, 2009a,b, and this work, respectively); the abundances of Pal 12 (Cohen 2004, filled red squares) and Ter 7 (Sbordone et al. 2007, open star symbols) have been corrected to our scale of solar abundances (see Gratton et al. 2003). Filled triangles indicate stars of the nucleus of Sgr from Carretta et al. (2010c).
Current usage metrics show cumulative count of Article Views (full-text article views including HTML views, PDF and ePub downloads, according to the available data) and Abstracts Views on Vision4Press platform.
Data correspond to usage on the plateform after 2015. The current usage metrics is available 48-96 hours after online publication and is updated daily on week days.
Initial download of the metrics may take a while.