Fig. 2
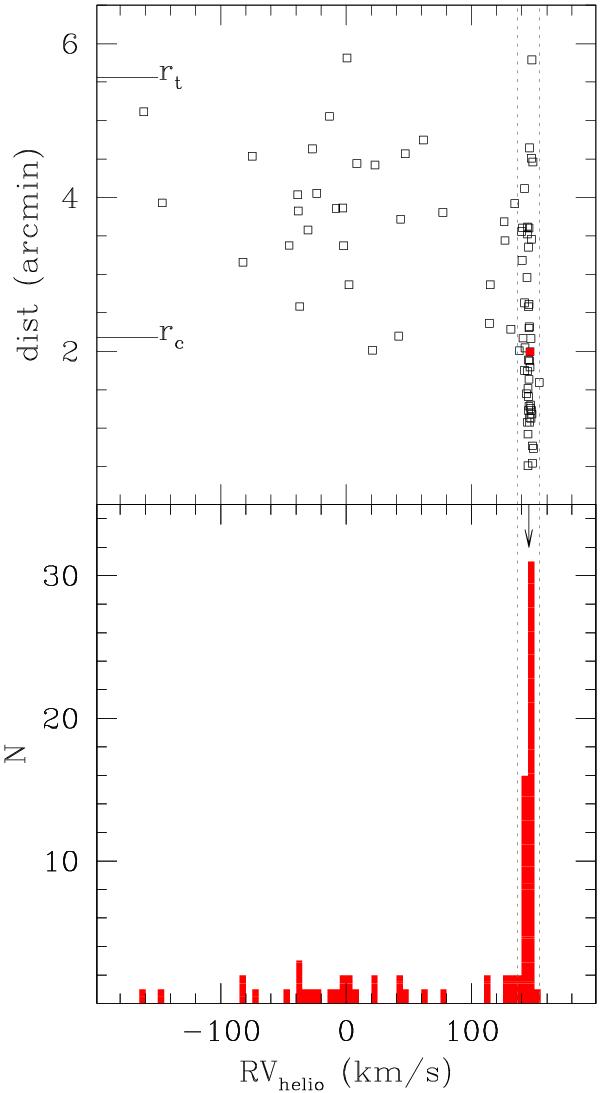
Upper panel: RVs vs. distance from the cluster centre. The core and tidal radii, from Salinas et al. (2012) are indicated. The filled red symbol is the high-Na star 2023 (see text). Lower panel: histogram of all RVs for the FLAMES spectra. The arrow indicates the average cluster RV at about 145.5 km s-1. The two vertical lines in both panels indicate ±3σ from the average.
Current usage metrics show cumulative count of Article Views (full-text article views including HTML views, PDF and ePub downloads, according to the available data) and Abstracts Views on Vision4Press platform.
Data correspond to usage on the plateform after 2015. The current usage metrics is available 48-96 hours after online publication and is updated daily on week days.
Initial download of the metrics may take a while.