Fig. 10
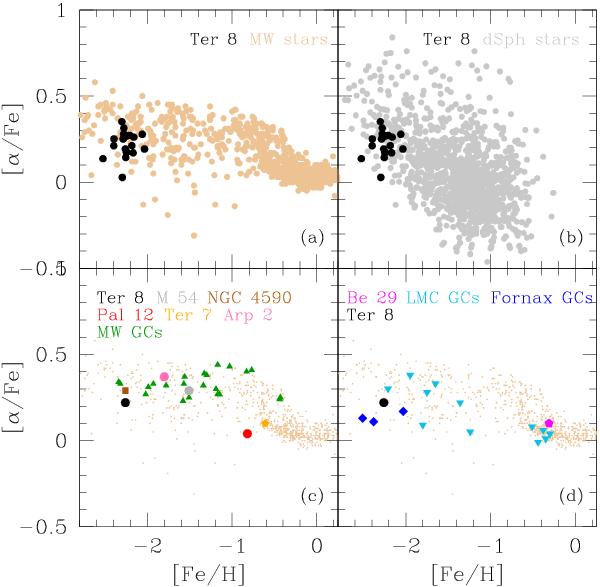
Ratio [α/Fe] versus metallicity in several Galactic and extragalactic stellar populations. In a) the ratios for individual stars analysed in Ter 8 (large black circles) are superimposed on stars in our Galaxy from the compilation by Venn et al. (2004; brown circles). In b) the individual values for Ter 8 are superimposed on those for stars in eight dwarf galaxies from the extensive study by Kirby et al. (2010; grey circles). The average [α/Fe] ratio for Ter 8 (black circle) is compared in panel c) to the average ratios of GCs associated with Sgr (M 54, grey circle; NGC 4590, brown square; Arp 2, magenta circle; Ter 7, orange star; Pal 12, red circle) and to the mean ratios for MW GCs (green triangles). Finally, in d) the average value for Ter 8 is compared to several extragalactic clusters: GCs in the Fornax dwarf galaxy (blue diamonds), clusters in LMC (cyan triangles), and Be 29, an open cluster associated with Sgr. As a comparison, the small brown dots in panels c) and d) indicate the field stars in the Galaxy from Venn et al. (2004).
Current usage metrics show cumulative count of Article Views (full-text article views including HTML views, PDF and ePub downloads, according to the available data) and Abstracts Views on Vision4Press platform.
Data correspond to usage on the plateform after 2015. The current usage metrics is available 48-96 hours after online publication and is updated daily on week days.
Initial download of the metrics may take a while.