Fig. 3
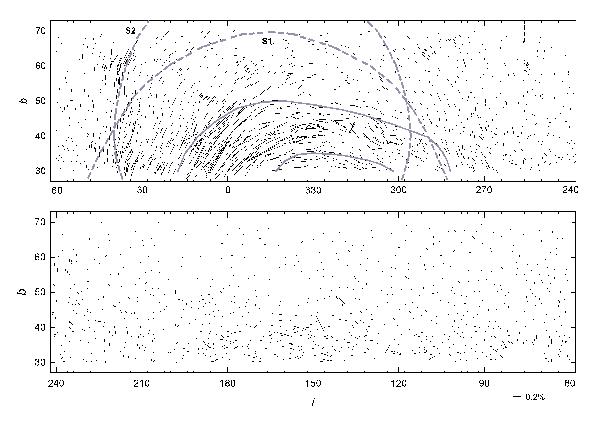
Map of interstellar polarization at high northern galactic latitudes: rectangular projection. The map shows the latitude range from 30° to 70°. The length of the bar is proportional to the value of polarization P. Thin vertical dashed lines show the eastern (255° < l < 300°), central (300° < l < 360°), and western (0° < l < 45°) latitude zones of the magnetic loop. Thick dashed lines show the outer walls of Wolleben’s S1 and S2 shells and the thick solid line shows the contour of the interaction ring between the Local Bubble and Loop I (see Sects. 8.2 and 8.3 for explanation).
Current usage metrics show cumulative count of Article Views (full-text article views including HTML views, PDF and ePub downloads, according to the available data) and Abstracts Views on Vision4Press platform.
Data correspond to usage on the plateform after 2015. The current usage metrics is available 48-96 hours after online publication and is updated daily on week days.
Initial download of the metrics may take a while.