Free Access
Fig. 3
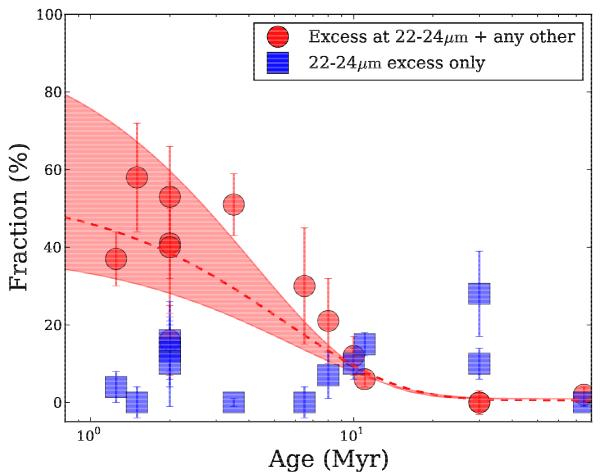
Fraction of primordial (red circles) and evolved (blue squares) disks as a function of age. The best fit exponential law for the primordial disk percentages is overplotted as a red line. The red shaded area represents the fit obtained for two extreme cases: the highest and lowest values at every age.
Current usage metrics show cumulative count of Article Views (full-text article views including HTML views, PDF and ePub downloads, according to the available data) and Abstracts Views on Vision4Press platform.
Data correspond to usage on the plateform after 2015. The current usage metrics is available 48-96 hours after online publication and is updated daily on week days.
Initial download of the metrics may take a while.