Fig. 4
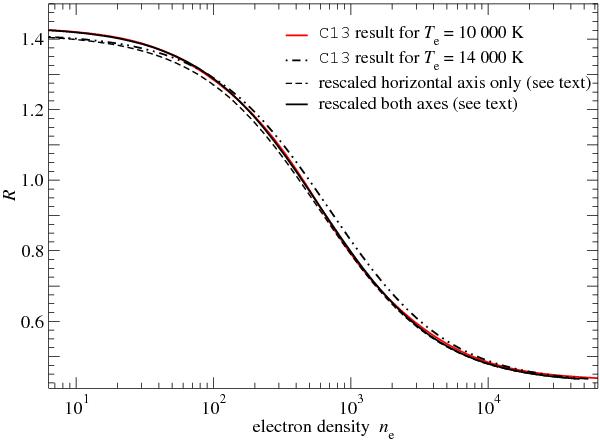
Scaling of the [S ii] density for other temperatures. A comparison of the diagram at Te = 10 000 K (red) and Te = 14 000 K (dash-dotted line) is shown. The rescale of the horizontal axis by ne(104/Te)1/2 (dashed line) is not perfect. An additional scale of the vertical axis results in nearly undistinguishable curves (solid black line). (This figure is available in color in electronic form.)
Current usage metrics show cumulative count of Article Views (full-text article views including HTML views, PDF and ePub downloads, according to the available data) and Abstracts Views on Vision4Press platform.
Data correspond to usage on the plateform after 2015. The current usage metrics is available 48-96 hours after online publication and is updated daily on week days.
Initial download of the metrics may take a while.