Fig. 16
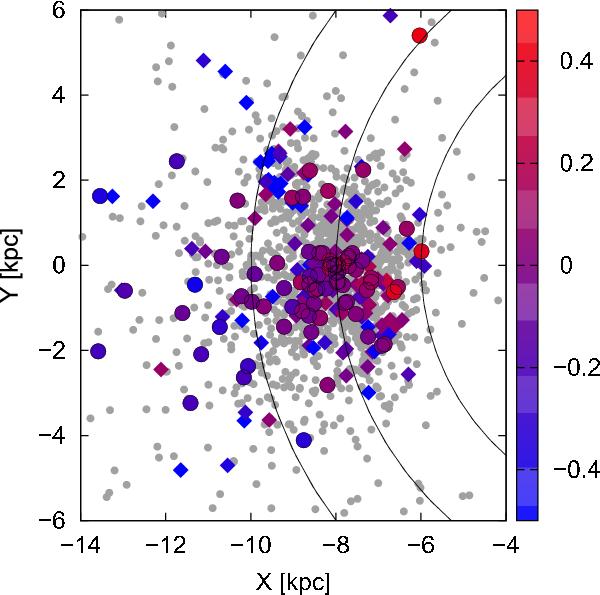
Distributions of the OCs from Paper I (diamonds), the OCs in the spectroscopic sample (coloured circles), and the OCs in the Dias et al. (2002, version 3.2) catalogue (grey circles) projected onto the Galactic plane, in a linear coordinate system where X increases from the Sun towards the Galactic centre, and Y increases in the direction of Galactic rotation at the location of the Sun. The Galactic centre is located at (X,Y) = (0,0). Metallicity is represented by the colour scale shown in the bar on the right. Solid lines indicate distances from the Galactic centre of 6, 8, and 10 kpc. Three clusters in the spectroscopic sample and one in the photometric sample lie outside the shown X range.
Current usage metrics show cumulative count of Article Views (full-text article views including HTML views, PDF and ePub downloads, according to the available data) and Abstracts Views on Vision4Press platform.
Data correspond to usage on the plateform after 2015. The current usage metrics is available 48-96 hours after online publication and is updated daily on week days.
Initial download of the metrics may take a while.