Fig. 7
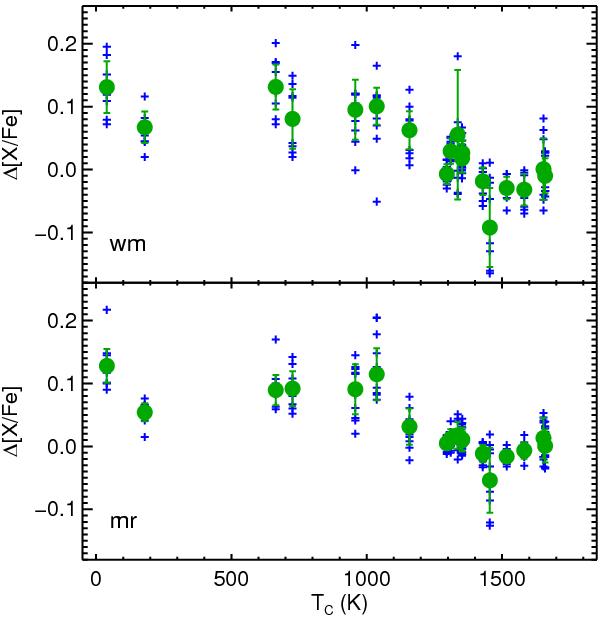
Maximum amplitude of refractory-element depletions. Crosses are the relative abundance ratios of the most refractory-element-depleted stars in our samples, using the pristine stars as reference for the Δ [X/Fe] values. Filled circles with error bars represent the weighted mean and standard deviation of the data plotted with crosses. Thus, they illustrate the amplitude of refractory-element depletions. The top (bottom) panel corresponds to the warm (metal-rich) sample.
Current usage metrics show cumulative count of Article Views (full-text article views including HTML views, PDF and ePub downloads, according to the available data) and Abstracts Views on Vision4Press platform.
Data correspond to usage on the plateform after 2015. The current usage metrics is available 48-96 hours after online publication and is updated daily on week days.
Initial download of the metrics may take a while.