Free Access
Fig. 5
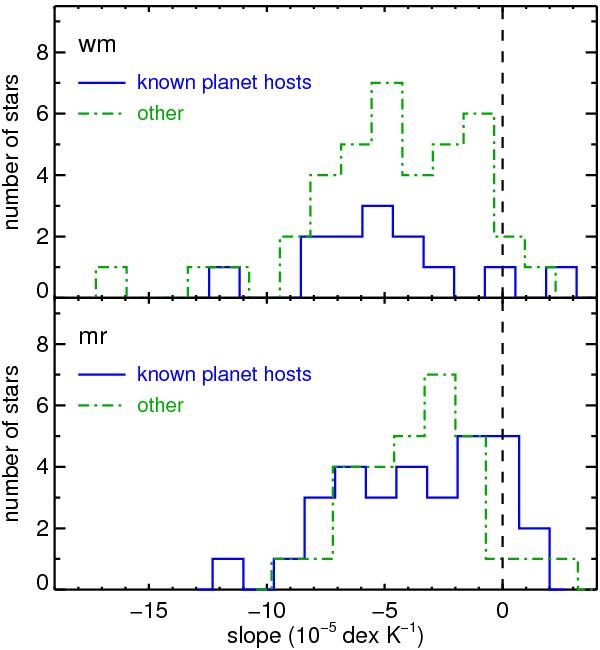
Distribution of Δ [X/Fe] versus TC slopes for stars with known planets (solid line histogram) is compared to that of the rest of stars in each sample (dot-dashed line histogram). The dashed line is at zero slope. The top (bottom) panel corresponds to our warm (metal-rich) sample.
Current usage metrics show cumulative count of Article Views (full-text article views including HTML views, PDF and ePub downloads, according to the available data) and Abstracts Views on Vision4Press platform.
Data correspond to usage on the plateform after 2015. The current usage metrics is available 48-96 hours after online publication and is updated daily on week days.
Initial download of the metrics may take a while.