Fig. 4
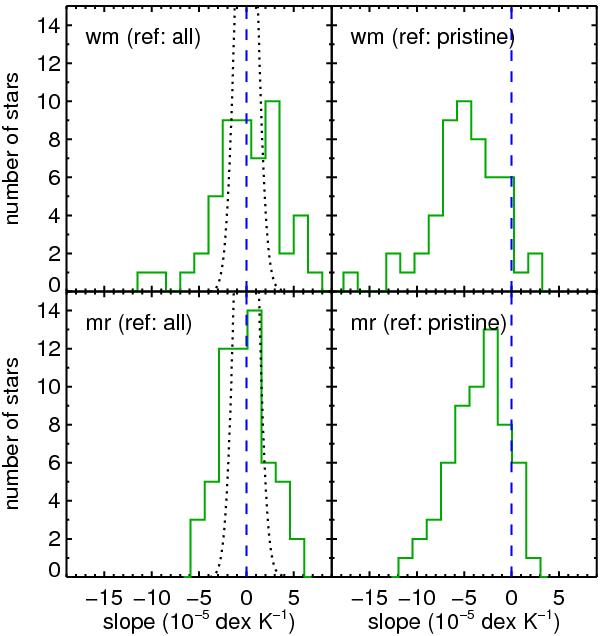
Left panels: distribution of Δ [X/Fe] versus TC slopes when the abundance ratios are measured with respect to the average of all stars. The dotted lines represent the distribution of slopes of data with no depletions and pure observational noise. Right panels: as in the left panels, but for the case when the abundance ratios are measured with respect to the average of stars with pristine composition. The dashed line is at zero slope. The top (bottom) panels correspond to our warm (metal-rich) sample.
Current usage metrics show cumulative count of Article Views (full-text article views including HTML views, PDF and ePub downloads, according to the available data) and Abstracts Views on Vision4Press platform.
Data correspond to usage on the plateform after 2015. The current usage metrics is available 48-96 hours after online publication and is updated daily on week days.
Initial download of the metrics may take a while.