Fig. 3
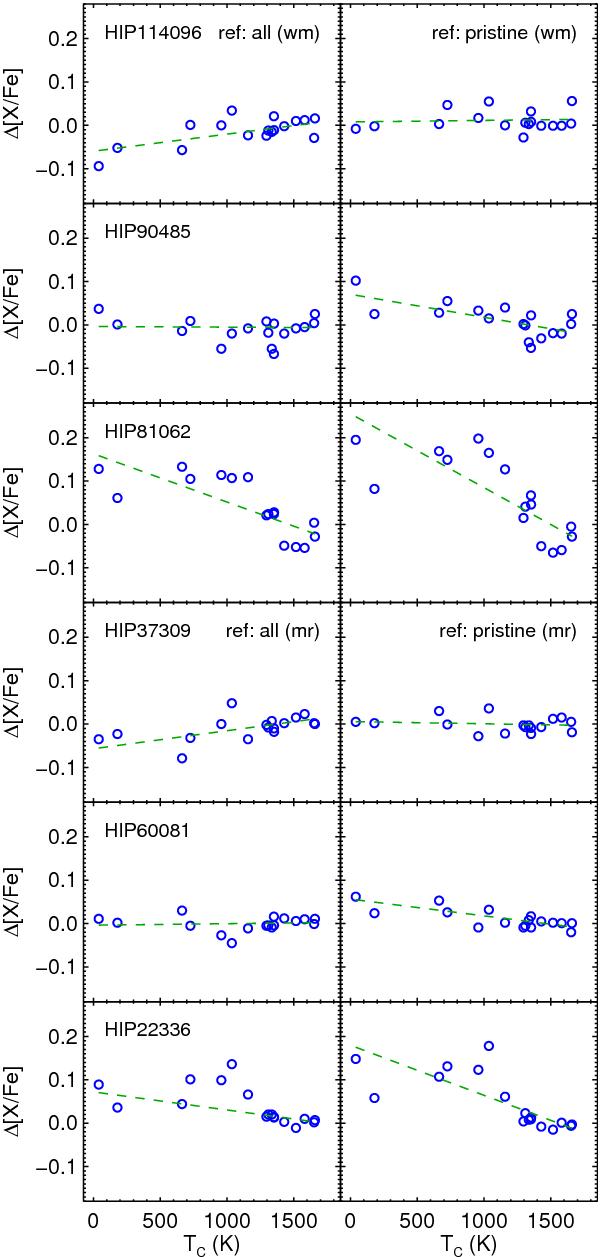
Left panels: relative [X/Fe] abundance ratios of a few representative sample stars with respect to the average values of all other stars as a function of the elements’ condensation temperature (TC). Right panels: as in the left panels, but with respect to the average values of stars that do not exhibit refractory element depletion (i.e., stars with “pristine” composition). Dashed lines are linear fits to the data. The top (bottom) three panels correspond to stars in our warm (metal-rich) sample.
Current usage metrics show cumulative count of Article Views (full-text article views including HTML views, PDF and ePub downloads, according to the available data) and Abstracts Views on Vision4Press platform.
Data correspond to usage on the plateform after 2015. The current usage metrics is available 48-96 hours after online publication and is updated daily on week days.
Initial download of the metrics may take a while.