Fig. 7
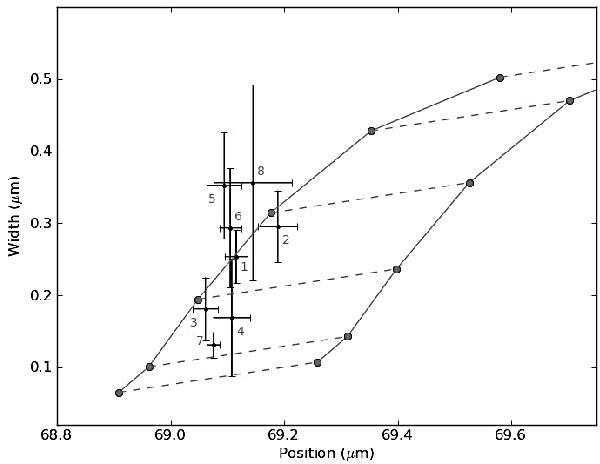
Width and position of the observed 69 μm bands against each other in black dots. Gray solid and dashed lines are the width and position of 69 μm bands from laboratory measurements and interpolations between them at different temperatures and compositions. The left solid gray curve is for crystalline olivine with 0% iron and with temperatures going from 50, 100, 150, 200, 295 K for the narrowest to broadest features. The right solid gray curve is for the same temperatures but for crystalline olivine with 1% iron (based on the interpolations of de Vries et al. 2012). Dashed gray lines connect points with the same temperature.
Current usage metrics show cumulative count of Article Views (full-text article views including HTML views, PDF and ePub downloads, according to the available data) and Abstracts Views on Vision4Press platform.
Data correspond to usage on the plateform after 2015. The current usage metrics is available 48-96 hours after online publication and is updated daily on week days.
Initial download of the metrics may take a while.