Fig. 5
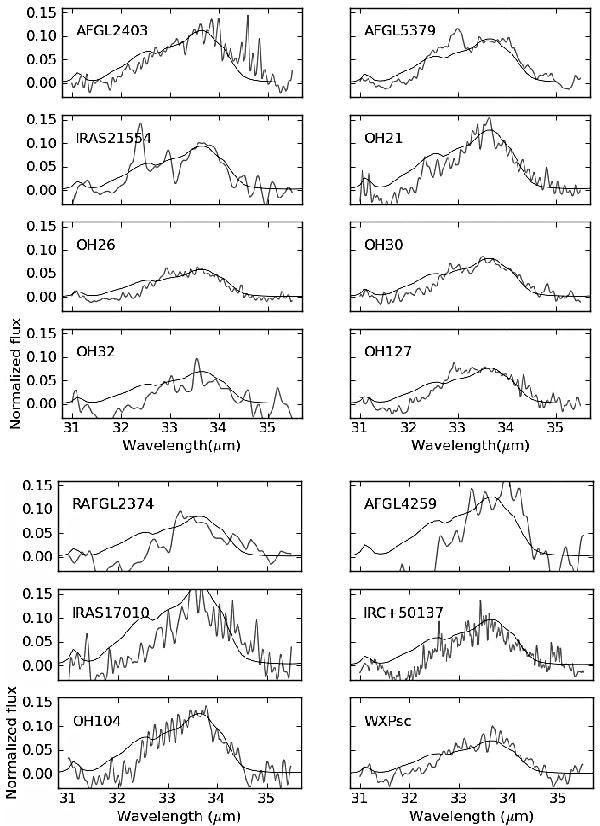
Normalized 33.6 μm bands derived from the spectra in the Sloan database (Sloan et al. 2003). The normalization is done by calculating (F/Fcontinuum) − 1. The scale of the y-axis is the same for all plots. In black are plotted the opacities of crystalline olivine (at 150 K, using CDE, see Sect. 5.1). The opacities are normalized to the level of the observed band in the range of 33.4−33.6 μm.
Current usage metrics show cumulative count of Article Views (full-text article views including HTML views, PDF and ePub downloads, according to the available data) and Abstracts Views on Vision4Press platform.
Data correspond to usage on the plateform after 2015. The current usage metrics is available 48-96 hours after online publication and is updated daily on week days.
Initial download of the metrics may take a while.