Fig. 4
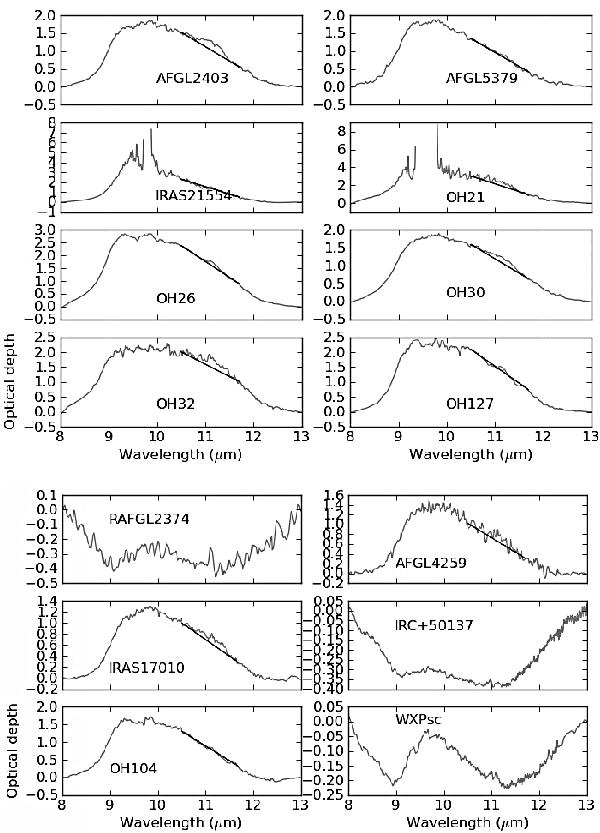
Optical depth (in gray) in the region of the 9.7 μm band of amorphous silicate. The calculation of the optical depth is described in Sect. 4.2 and de Vries et al. (2010). In black the local continuum used under the 11.3 μm band. The flux levels of IRAS 21554 and OH 21.5+0.5 go below zero in the region of 9.7 μm. Those points are not used to calculate the optical depth and are excluded from these plots.
Current usage metrics show cumulative count of Article Views (full-text article views including HTML views, PDF and ePub downloads, according to the available data) and Abstracts Views on Vision4Press platform.
Data correspond to usage on the plateform after 2015. The current usage metrics is available 48-96 hours after online publication and is updated daily on week days.
Initial download of the metrics may take a while.