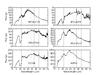
Fig. 2

ISO-SWS spectra for the OH/IR stars. The data are taken from Sloan et al. (2003). For the sources OH 21.5+0.5 and IRAS 21554 the flux levels go below zero in regions below 5 μm and in the 9.7 μm band. Those negative flux values are indicated with gray dots. Peaks in the opacity curve of crystalline olivine at 11.3, 23.5, 27.5 and 33.5 μm are indicated with vertical gray lines.

Current usage metrics show cumulative count of Article Views (full-text article views including HTML views, PDF and ePub downloads, according to the available data) and Abstracts Views on Vision4Press platform.
Data correspond to usage on the plateform after 2015. The current usage metrics is available 48-96 hours after online publication and is updated daily on week days.
Initial download of the metrics may take a while.