Fig. 1
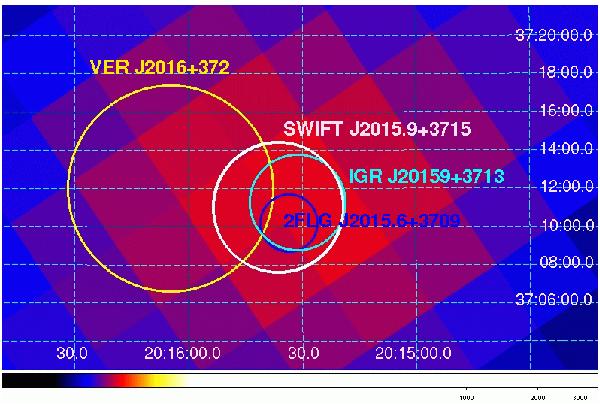
IBIS 17−60 keV significance map containing IGR J20159+ 3713/SWIFT J2015.9+3715. The white circle corresponds to the IBIS positional uncertainty, while the light blue is that from BAT 70 month survey; the small dark blue circle shows the positional uncertainty of the Fermi source, while the large yellow circle represents the area where the VERITAS emission comes from.
Current usage metrics show cumulative count of Article Views (full-text article views including HTML views, PDF and ePub downloads, according to the available data) and Abstracts Views on Vision4Press platform.
Data correspond to usage on the plateform after 2015. The current usage metrics is available 48-96 hours after online publication and is updated daily on week days.
Initial download of the metrics may take a while.